What Happens When the S&P 500 is Down 25%?

by Angelo Goodenough Nov 22, 2022 Financial Planning, Investment Consulting

These days, looking at your portfolio should come with a “proceed with caution” warning. As investors, even though we understand that corrections and bear markets are inevitable, that doesn’t make them any less disheartening.

One common measuring stick for the stock market is the S&P 500. Historically, this index averages a positive return of about 7% - 7.5% per year or 10% per year when you add in dividends; however, if you’ve been following the headlines, you likely know that the S&P 500 is down around 25% for 2022 as of September 30.

In this article, we’ll explore what that figure means and what we can attempt to infer moving forward.


The S&P 500 as we know it today was introduced by Standard & Poor’s in 1957. It is a market-capitalization-weighted index consisting of 500 or so large capitalization companies trading in the United States. That definition is a mouthful, so let’s break down a few of the key terms:
  • A company’s market capitalization is determined by its total outstanding shares multiplied by its current share price in the market. So, this number is one that is constantly fluctuating while the market is open between 9:30 am and 4:00 pm, Monday through Friday.
  • A company is classified as a large capitalization stock if its market capitalization is over $35.8B. A subclass is a mega capitalization stock which is generally something valued over $158.7B. A mid-capitalization stock is valued between $6.3B and $35.7B, and a small capitalization stock is valued between $1.7B and $6.2B. A subclass is a micro capitalization stock which is a company valued at less than $1.6B.
  • A market-capitalization-weighted index is an index that weights companies by their market capitalization (as opposed to their market price per share). For example, if there are 10 companies in an index and the total market capitalization for all of them is $100B, a company with a $50B market capitalization will consist of 50% of the index. The performance of larger companies will have more of an impact than that of smaller companies on the index. Popular U.S. examples include the S&P 500 and the NASDAQ.
The S&P 500 is highly recognized as a proxy for the U.S. equity markets by containing leading companies from 11 sectors, 69 industries, and 158 sub-industries. To be qualified for the index at the time of inclusion, 10% of the company’s share must be available for public trading, and the company must have positive earnings over the last four quarters. The S&P 500 represents around 83% of the total U.S. equity market capitalization.

How often does the S&P 500 drop 25%?

Between the start of January 2022 and the end of the 3rd quarter, the S&P 500 index officially breached the negative 25% return mark. To understand what historically transpires in this situation, we can look at the data.

chart-1
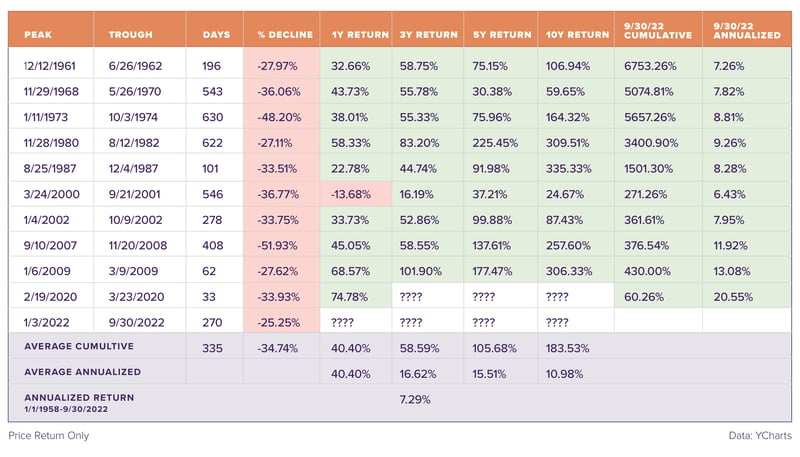
Since the index was introduced in 1957, the S&P 500 has dropped 25% or more 11 times now.

This chart reflects a large variance between the amount of the decline and the length of the decline over the years; however, we are nearing the length of time of an average drawdown. With that being said, the drawdown is not as bad as the average that it usually experiences.

Now, time for some positive news! Obviously, there is a lot of green on that chart. This shows that over short, intermediate, and long-time horizons, you will likely see positive returns after a decline as steep as 25%.

What happens when you invest at the peak?

As some of you may know, market timing is virtually impossible to do, so the above example is theoretical. Here is another theoretical example, what do returns look like if you were to invest at the peak instead of the trough?

chart-2 (2)

A takeaway is that although it may take some time, returns eventually turn positive even though they lack the average annualized return of 7.29%. It is virtually impossible to time the exact top of the market just like it is to time the exact bottom. A strategic investor may choose to dollar cost average into the market to avoid trying to time the market; 401k investors will do this naturally over time.

Taking a cue from history.

A standard disclaimer in financial literature is that past performance is not indicative of future results. That is still true, but here at Sanderson, we hope that looking at what has happened historically shows that things typically turn out to be okay for the stock market over the longer term.

Clearly, there are both good and bad times to invest, but we trust that patience, diversification, and timely rebalancing will help our client portfolios experience a smoother ride that is rewarded over the long term. 

Past data indicates that much of the worst may be behind us in the markets. We have been through this before at Sanderson, and we will get through this again. This substantial decline in the market does provide an opportunity for new cash to be put to work in the market through investments in stocks, bonds, and non-traditional assets. Please do not hesitate to reach out to us if you have questions or want to discuss any opportunities.

Disclosure

© 2022 Sanderson Wealth Management LLC. This information is not intended to be and should not be treated as legal, investment, accounting or tax advice and is for informational purposes only. Readers, including professionals, should under no circumstances rely upon this information as a substitute for their own research or for obtaining specific legal, accounting, or tax advice from their own counsel. All information discussed herein is current as of the date appearing in this material and is subject to change at any time without notice. Opinions expressed are those of the author, do not necessarily reflect the opinions of Sanderson Wealth Management, and are subject to change without notice. The information has been obtained from sources believed to be reliable, but its accuracy and interpretation are not guaranteed.