As election anxiety grips the nation, it is easy to let our emotions drive our financial decision making. In moments like this, our past can give us a more objective perspective. Historical trends can shed light on the long-term outlook for the economy, without the complications of current COVID-19 fears and the looming 2020 presidential election.
Here’s the historical data you need to understand the relationship between presidencies, the markets, and elections.
The Presidencies and the S&P 500.
First, let’s take a look at the success of the S&P 500 - the market value of the largest companies in the USA - over different presidencies. Since the index has been calculable, there have been 15 presidents, and only three of them saw a drop in the S&P 500 Price Index value. For calculation purposes, we measured the president’s impact from the day after their election, not from inauguration.
| President | S&P 500 Return |
| Herbert Hoover | -67.4% |
| Franklin D. Roosevelt | 94.1% |
| Harry S Truman | 75.1% |
| Dwight D. Eisenhower | 124% |
| John F. Kennedy | 26.3% |
| Lyndon B. Johnson | 48.1% |
| Richard M. Nixon | -21.6% |
| Gerald R. Ford | 27.5% |
| Jimmy Carter | 25.2% |
| Ronald Reagan | 113.2% |
| George H. W. Bush | 52.6% |
| William J. Clinton | 241% |
| George W. Bush | -29.8% |
| Barack Obama | 112.7% |
| Donald J. Trump | 53.4% |
What happened in the three presidencies that saw an S&P 500 downturn? Each coincided with a disastrous economic event.
- Under Herbert Hoover, it was the Great Depression -- the US saw a peak-to-trough drop of 86%, devastating the markets and throwing the country into turmoil.
- After nearly 50 years of post-Depression market recovery, Richard Nixon resigned from office amid the OPEC Oil embargo. Soaring oil prices and inflation dropped the markets by 48%.
- At the end of George W. Bush’s presidency, the US housing bubble burst and crippled the biggest banks in the world. We watched Bear Stearns and Lehman Brothers fail. The uncertainty and lack of liquidity drove the markets down 57% at its worst.
Thankfully, we’ve seen more growth under the other 12 presidencies we’ve experienced over the past 90 years. S&P 500 prices have improved during 80% of presidencies, with long stretches of prosperity between major drawdowns (44 years between Hoover and Nixon and 28 years between Nixon and George W. Bush).
The Long Term.
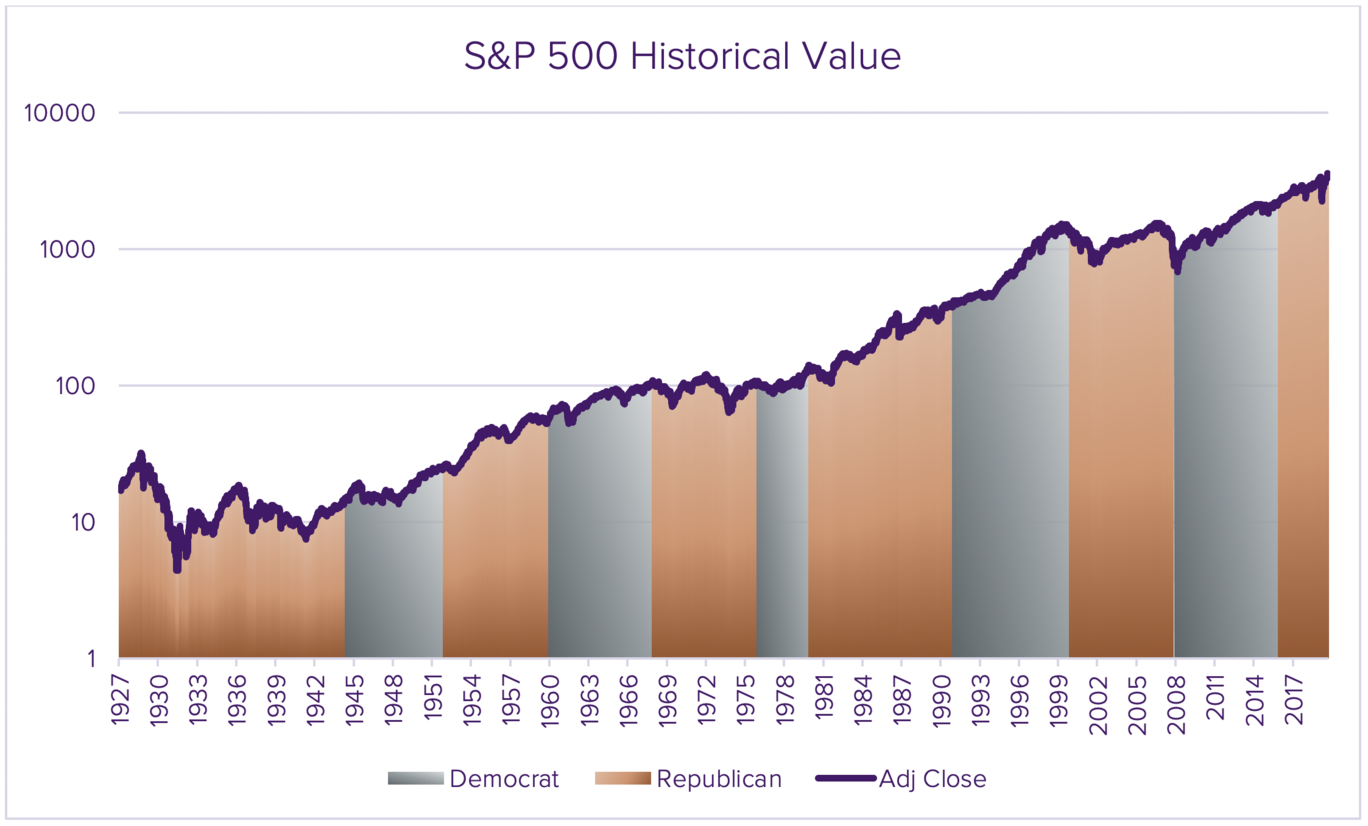
When considering how risky it is to invest, it’s worth keeping the long game in mind. Generally, money in stocks won’t be spent for years, decades, or even generations. As we’ve just seen, the market has continued to grow over the past 90 years, through presidencies of both parties. In fact, the chart below suggests that regardless of temporary downturns or political policies, America’s capitalism engine keeps on chugging, and the value of our public companies continues to increase.
The Markets and Election Uncertainty.
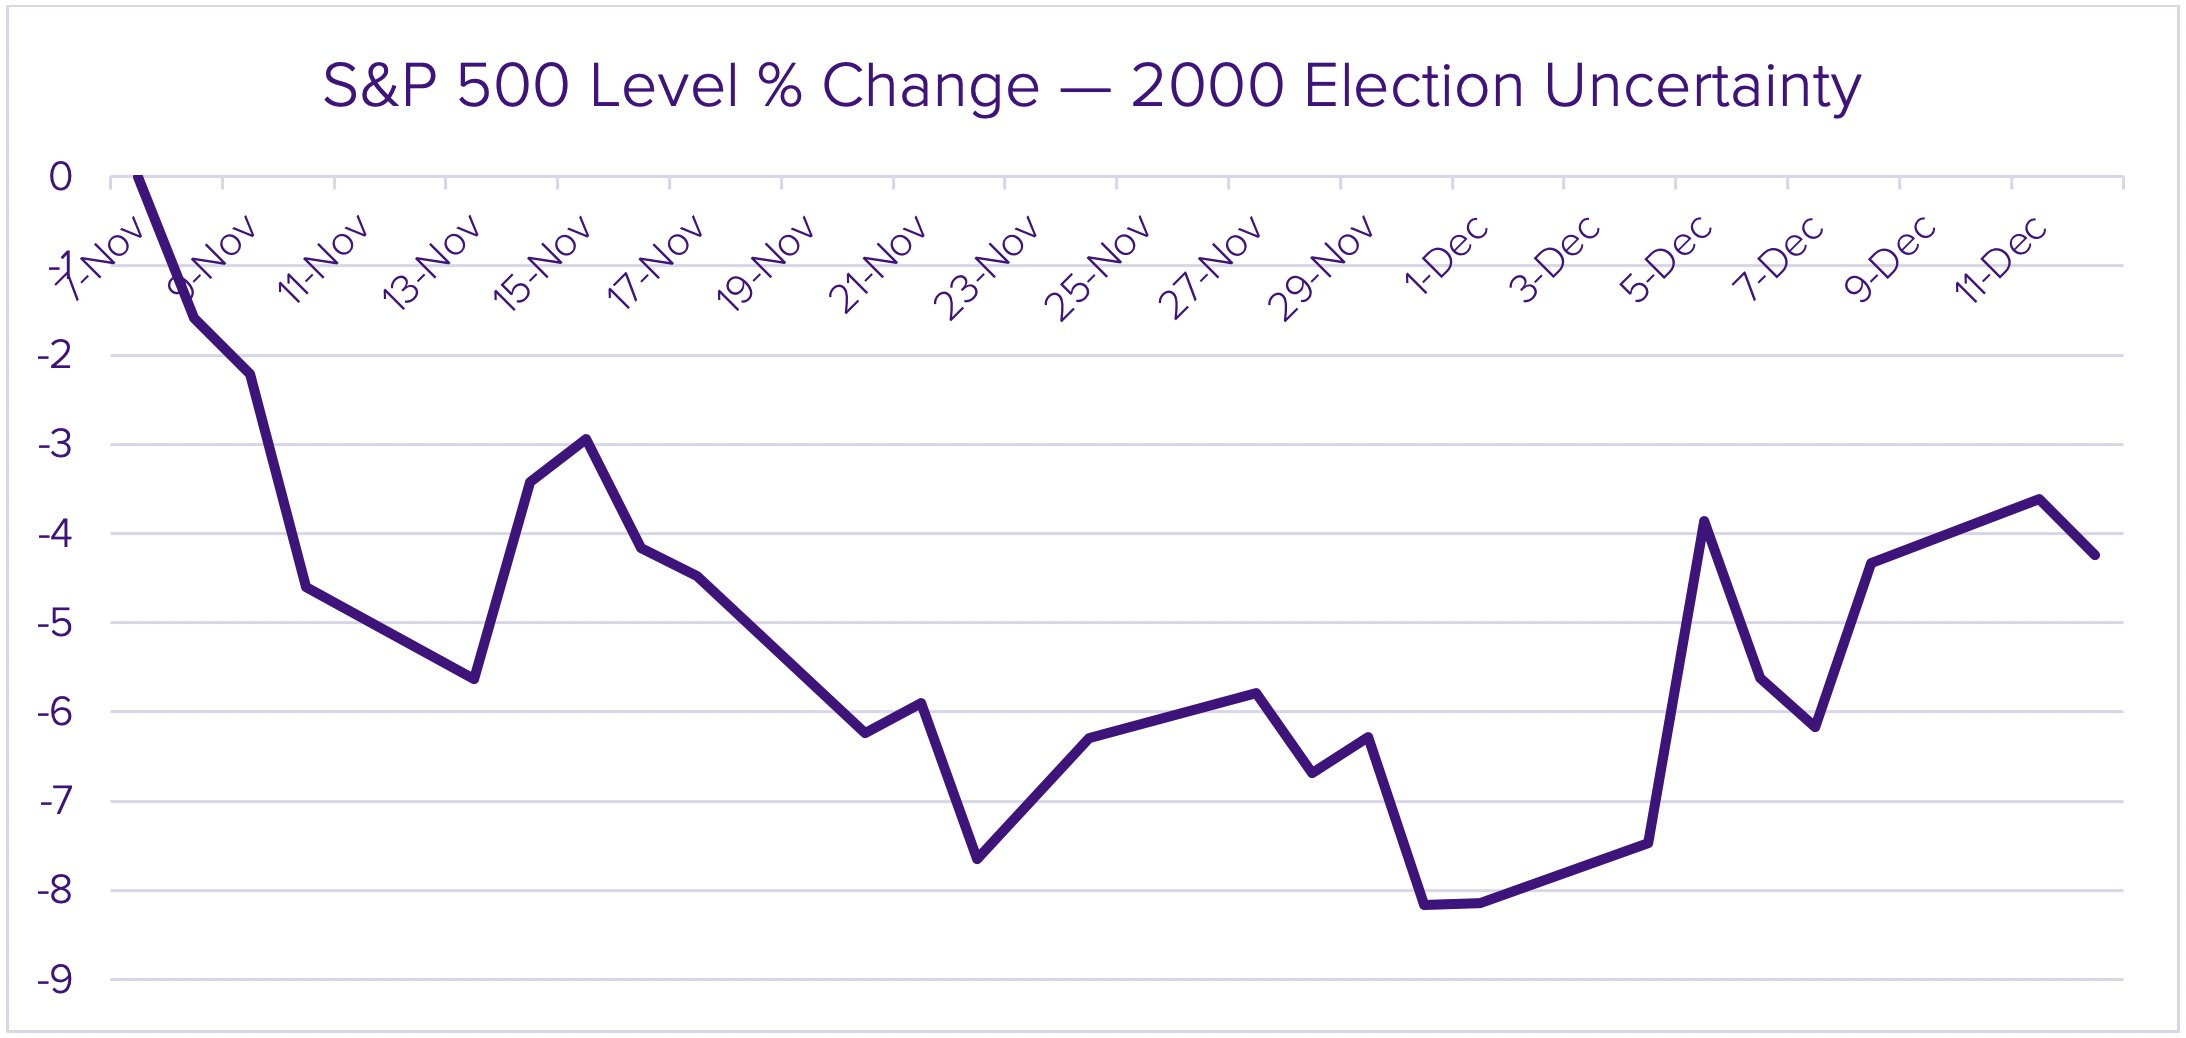
Despite this overall upward trend, the markets are still sensitive to political uncertainty. Many of us vividly remember the 2000 election -- a tightly contested battle between Vice President Al Gore and Governor George W. Bush that dragged from November 7 until Al Gore’s concession on December 13. The markets took a 8% dip during the 36-day period without a president-elect. No matter how robust the market, there is still a chance of this (albeit temporary) volatility.
Perspective.
It’s disconcerting to have so much unknown in front of us: a challenging voting season, COVID-19 concerns, and amplified emotions across the country. Despite some volatility and weakness in the past few weeks, the US market has stayed resilient and is largely higher than we were in 2019. We can look back on nearly a century of data that points to more stable days ahead, when investors and advisers can get back to focusing on the things that fuel our capitalism engine here in the US, the greatest wealth creator in the world.