When we look at the market’s performance so far during the COVID-19 era, the economic data and S&P 500 tell two different stories. A record 36-million Americans have filed for unemployment and consumer spending dropped a record -16.4% in April. Yet the S&P 500, the market-capitalization-weighted index of domestic large-cap companies, is only down 11% this year through May 14.
Let’s dive in to see if we can paint a more accurate picture of the market performance this year.
How the sectors stack up as of May 14, 2020.
There are 11 main sectors of the S&P 500. For the year, 10 of them are negative. The real bifurcation becomes evident when looking at the top- and bottom-performing sectors. With people forced to spend more time in the digital world, technology is the lone shining star and up 2% for the year. Demand for software and cloud computing capabilities have skyrocketed and those companies tied to digital payments, working from home, streaming entertainment, etc. are all in overdrive.
As one would expect during a global pandemic, companies in the healthcare industry have seen demand increase and as a whole are only down only -1.7%.
Some of the notable top performers in the index are:
- Regeneron (+52%, healthcare)
- NortonLifeLock (+40.3%, technology/software)
- NVIDIA (+36.6%, technology)
- Netflix (+36.6%, communication/technology)
- Clorox (36%, consumer defensive)
- PayPal (+33.5%, financial services/digital payments)
- Citrix (+32%, technology)
At the bottom of the list are banks, insurance companies, and other financial institutions that have suffered a -30.5% drawdown as a sector. The oil, gas, and other energy firms have been the most impacted, suffering a -38.38% loss. This sector took a combination of punches on the chin. The left hook was decreased demand as travel slowed during the pandemic but the uppercut was oil prices plummeting due to a supply glut caused by an oil war between the world’s largest producers.
These companies can be found in the 30 worst-performing stocks:
- Noble Energy (-65.7%, energy)
- Occidental Petroleum (-64.5%, energy)
- Invesco (-59.7%, financial services)
- Alliance Data Systems (-64.5%, financial services)
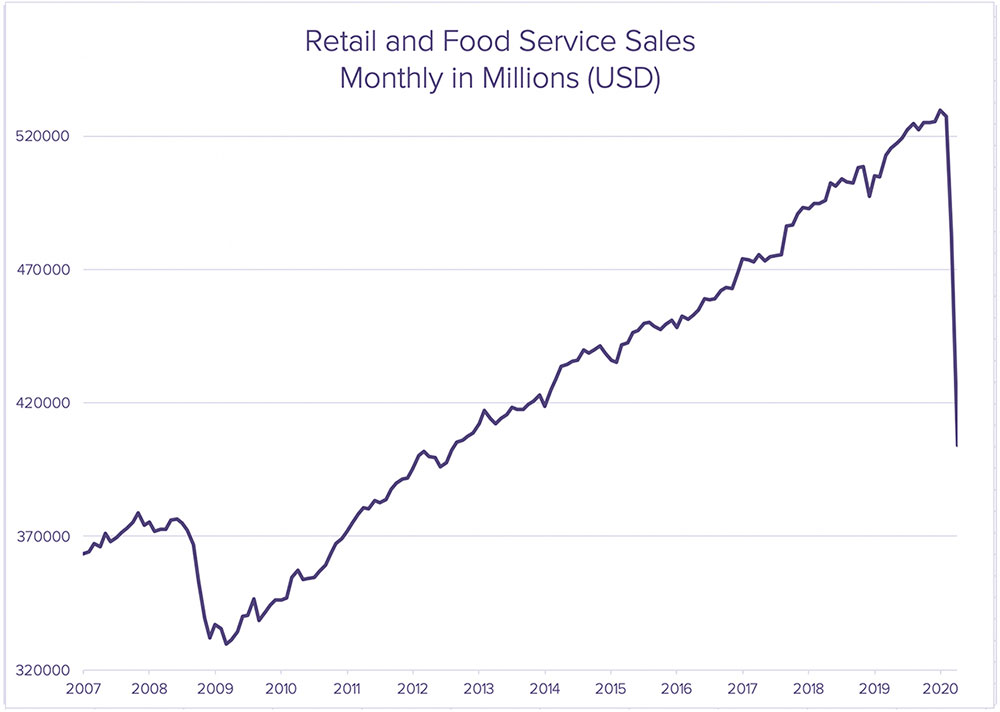
Other areas of mention are retail and real estate. The real estate sector has suffered a -19% drawdown. While some of these sectors should experience a bounce-back after the country begins to reopen, others have suffered permanent damage. Retail, especially brick-and-mortar shops, were already facing strong headwinds from e-commerce and may never fully recover. The chart below show the monthly sales for retail and food service across the United States for the past 20 years. April 2020 sales of these companies have dropped a record -16.4%. According to the US Census Bureau, clothing, electronics/appliances, and furniture all suffered declines greater than 50%!
Two prominent retail stores, J. Crew and Neiman Marcus, have already filed for bankruptcy. With physical store revenue and foot traffic plummeting, this does not bode well for those that are managing and collecting rents on those properties, including commercial real estate investment trusts. The US commercial REIT industry has already suffered a -25.9% loss YTD.
The story continues as we examine the size and performance of the individual companies that make up these sectors within the index.
Big tech reigns.
The range of individual stock performance in the S&P 500 this year is +84% to -81.6%, with the average stock being down -19.84%. Around 410 stocks are in the red and 90 in the green. Thanks to the market-cap-weighted nature of the S&P500, the top stocks dominate performance.
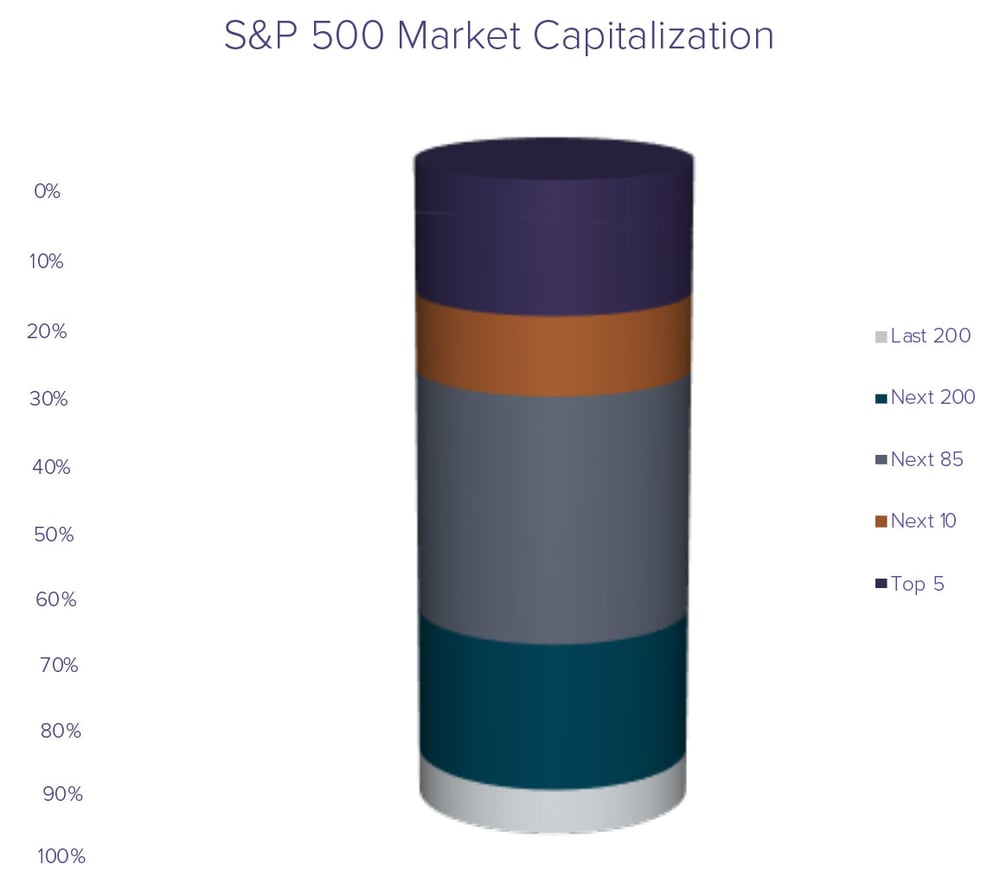
Top five in S&P500:
- Microsoft: +14.8% YTD
- Apple: +5.94%
- Amazon: +29.3%
- Google (Alphabet): +1.37%
- Facebook: +.76%
Clearly, these top-five stocks have more in common than just their size. They are all in the same general area of business: technology. Each of these five companies far outpaced the average performance of a stock in the index.
Bottom of the barrel.
The stocks at the bottom of the market cap list have also been some with the worst performance and are dominated by travel and retail. These include Gap, Kohls, Nordstrom, and Norwegian Cruise Lines, which have all suffered losses greater than 50% this year. The absolute worst performers are airlines and cruise lines (Delta, American, United, Carnival, and Royal Caribbean), which are all down well over 65%.
What it all means.
It is now clearer that the sector and size bifurcation paints the picture of the US market performance—not necessarily a simple market-cap-weighted average of stock returns. The S&P performance is a result of the largest companies being concentrated in sectors that are at the forefront of our new world. For those companies that do not meet those specifications, the future is uncertain. Investors should be mindful of the diverging paths companies may take, and be sure to include active management where teams of portfolio managers and analysts are living in the space and making decisions on how your capital should be deployed.
Sources:
Sector performance: SPDR sector ETF performance via Ycharts.com
Real estate data: FTSE NARIET All Equity REIT index