Index Overview
Financial markets use indices as benchmarks to evaluate investment returns, market trends, and the economic condition of specific sectors or the overall market. Indices can track a wide range of data from market capitalization (total shares outstanding of stock multiplied by stock price), geographic regions, and sector exposure (financial services, technology, healthcare, etc.) using a variety of approaches to determine the weights of the underlying holdings.
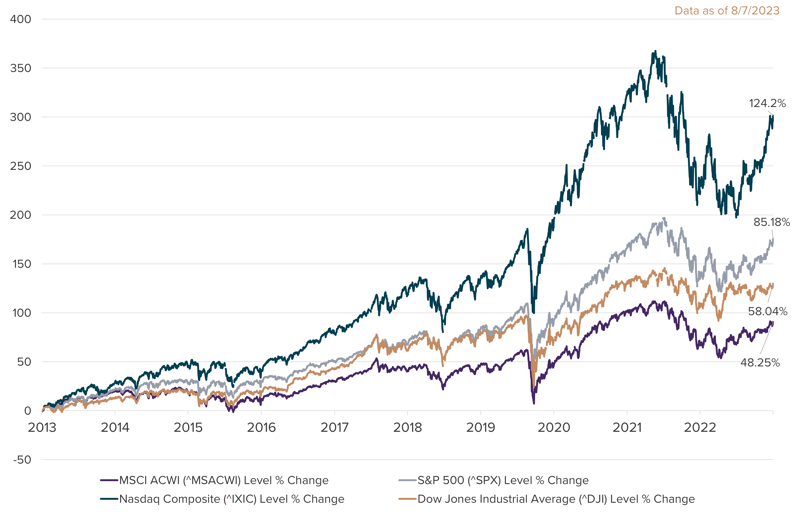
Some of the prominent indices that track the economic condition of the US and global markets are the Standard & Poor’s 500, MSCI All Country World Index, NASDAQ Composite, and the Dow Jones Industrial Average. The ensuing information illustrates each index and its unique characteristics to distinguish itself as a potential benchmark:
S&P 500
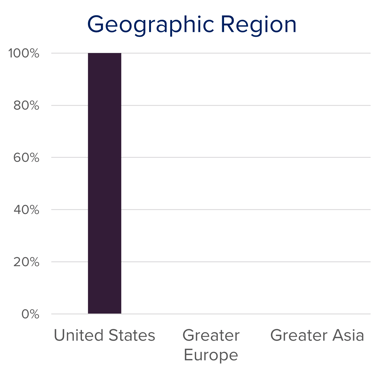
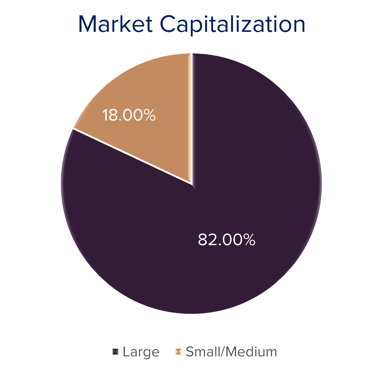
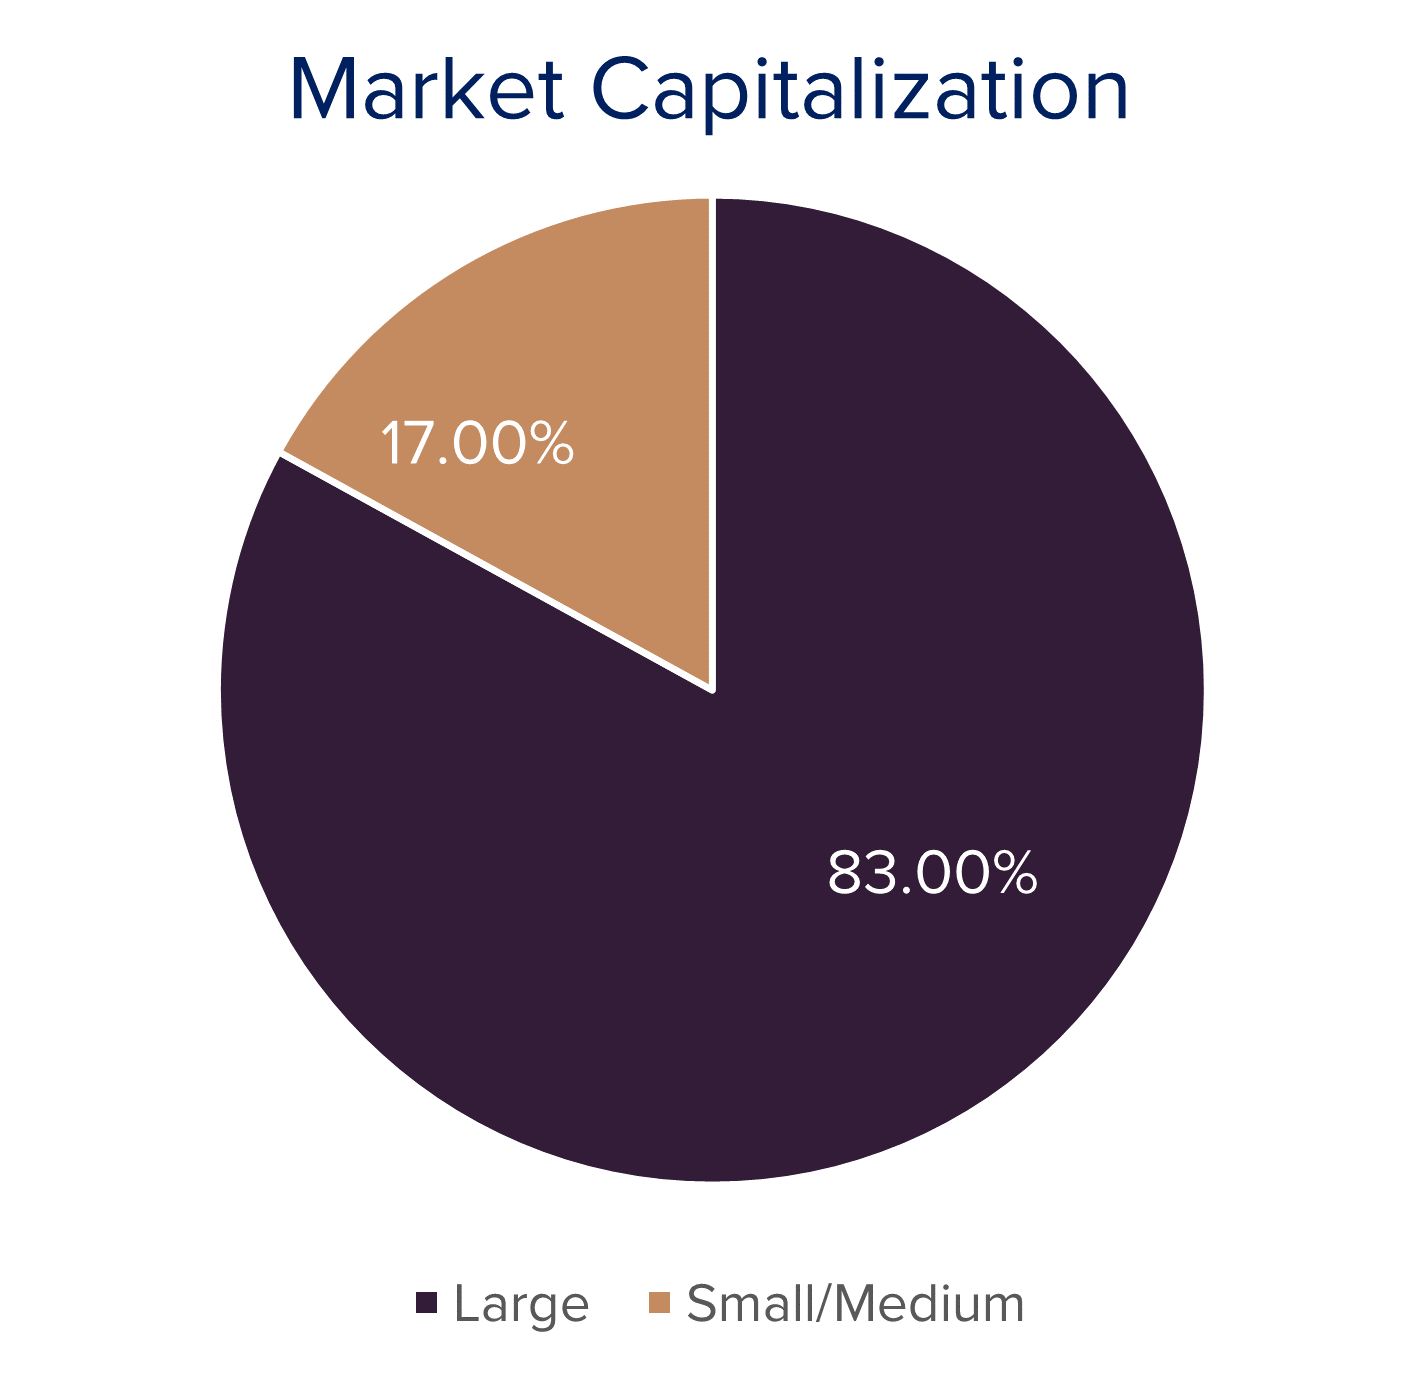
The Standard & Poor’s 500 index, also known as the S&P 500, is comprised of 500 large companies listed across a range of sectors on US Stock Exchanges. The index is periodically rebalanced based on changes to the underlying companies and the current economic state. Due to the diverse US market exposure within large companies, the S&P 500 is looked at as a gauge for the health of the US corporate economy and is often used as a benchmark for domestic investors.
The S&P 500 index uses a market capitalization weight, meaning the components are weighted based on the value of its respective company's total stock. This strategy gives the largest companies the most influence on the index’s performance.
 |
 |
MSCI ACWI
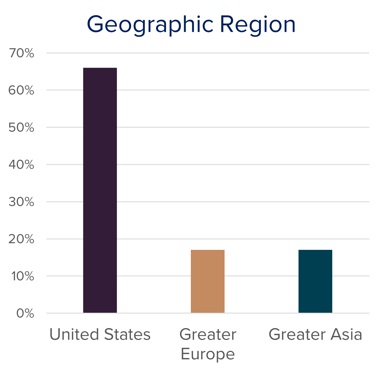
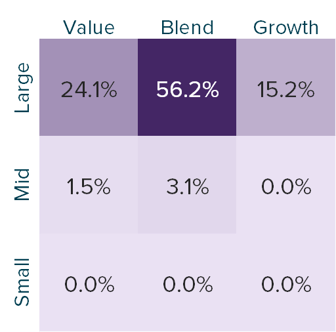
The MSCI All Country World Index (MSCI ACWI) holds nearly 3,000 stocks across 47 developed and emerging market countries across the globe. The MSCI ACWI holds a roughly 60% country weight to the US and includes medium- and large-size companies, providing a more globally diversified approach to economic conditions than the S&P 500. The MSCI ACWI can be utilized as a benchmark for investors looking to have a global approach in their portfolio.
Like the S&P 500, the MSCI ACWI uses a market capitalization-weighted approach. However, the larger number of companies held dilutes the effects of the largest companies.
 |
 |
NASDAQ
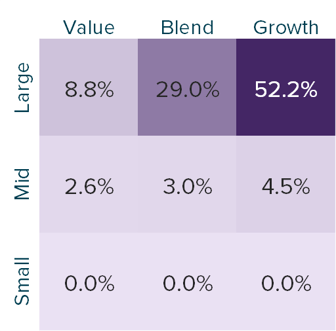
The NASDAQ Composite is a broad market index holding only companies listed on the NASDAQ exchange. The index heavily focuses on technology with allocations to companies like Apple, Microsoft, and Amazon, but also incorporates small- and medium-sized companies and different sectors. With nearly 3,000 holdings, it is far larger than the S&P 500 and DJIA for US indices.
Similar to the S&P 500 and MSCI ACWI, the NASDAQ Composite Index uses market capitalization to weigh the holdings. The index is often benchmarked for domestic growth-focused investors.
Top Market Capitalization Weighted Holdings
Based on the market capitalization weight approach, the top holdings for the S&P 500, MSCI ACWI, and NASDAQ Composite are nearly identical. However, each has a different allocation weight based on factors such as the number of holdings in the index, the exchange used, and the geographic location used for the index.
The top holdings for these indices include:
• Apple
• Microsoft Corp
• Alphabet (Google)
• Amazon
• NVIDIA
• Tesla
• Meta
DJIA
The Dow Jones Industrial Average (DJIA) is very unique compared to the S&P 500, MSCI ACWI, and NASDAQ Composite. The DJIA is composed of only 30 large companies and uses a price-weighted average to allocate the index. Instead of the largest companies having the greatest influence (like the S&P 500, MSCI ACWI and NASDAQ), the highest stock price has the greatest influence on the DJIA index. The 30 companies in the DJIA are valued based on the price of the stock, which fluctuates with market movement and stock splits. The higher the stock price, the larger the representation in the DJIA. The DJIA is often quoted out of tradition rather than for a benchmark’s effectiveness for a portfolio comparison.
The top five price-weighted companies in the DJIA as of August 2023 are:
• UnitedHealth Group
• Goldman Sach Group
• Microsoft Corp
• Home Depot
• McDonalds Corp
Key Takeaways
These benchmark indices are a useful tool to measure performance against a related portfolio and the overall health of the US and global corporate economy. These indices, and many others, are constructed to convey a wide range of information to the general public to allow for informed decisions when opting to invest or sell stocks in the various markets.

- Prominent indices that track the economic conditions of the US and global markets are the S&P 500, MSCI All Country World Index, NASDAQ Composite, and the Dow Jones Industrial Average
- The S&P 500 index is comprised of the 500 largest public companies listed across a variety of sectors on the US Stock Exchanges
- The MSCI ACWI holds nearly 3,000 stocks across 47 developed and emerging market countries across the globe providing a more global approach than the S&P 500
- With a focus on technology, the NASDAQ Composite holds 3,000 companies including allocations to Amazon, Apple, and Microsoft in addition to small to medium sized firms and different sectors.
- The DJIA uses the price-weighted average of 30 large companies resulting in the highest stock prices held in the index having the greatest influence on the DJIA price